1 Lab 1: Earth Systems and Earth’s Four Spheres
Allison Lutz and Crystal Huscroft
Both professionals and researchers can tell a lot about the physical processes operating on a landscape by carefully observing it. This lab will connect you with the geography of the place in which you live and hone your landscape observation skills. It is an important skill to describe the more natural and anthropogenic features of the landscape, and to consider ways in which a change in one aspect may affect all others. It is only as we seek to understand the interconnectedness of Earth spheres and systems that we will find appropriate solutions to our global environmental issues.
Learning Objectives
After completion of this lab, you will be able to
- Orient a map to the landscape.
- Draw a simple sketch map.
- Name and identify natural and built features of the local area.
- Observe and record characteristics of the local atmosphere, lithosphere, hydrosphere, and biosphere.
- Describe the anthropogenic impacts on natural systems.
- Examine examples of positive and negative feedback systems at work.
- Describe potential changes to natural systems.
Pre-readings
To complete this lab, students need background information on geographic approaches and themes, Earth spheres, and systems theory. These topics are typically covered in Chapter One of first-year geography textbooks. Use the textbook’s index to find these topics, then read about them in order to supplement the descriptions below..
Earth Spheres
Our natural environment can be broken down into four interacting and overlapping “spheres”. In this lab you will be asked to note evidence of processes occurring within these spheres, so it is important to review them and think of possible signs in the landscape of how they operate and have produced the landscape you will observe.
The hydrosphere consists of water in all its forms (solid, liquid, and gas; fresh and salty), as it appears at or near the Earth’s surface. It includes oceans, rivers, lakes, springs, glaciers and ice caps, shallow groundwater, and atmospheric water vapor.
The atmosphere is a mixture of gases, forming an envelope around the Earth, and held in place by gravity. Up to an altitude of about 80 km the composition is nearly constant at 21% oxygen, 78% nitrogen, and traces of argon, xenon and krypton. In addition, there are variable quantities of carbon dioxide, methane, and water. We are most interested in the troposphere, the lower 18 km where weather and climate are determined.
The lithosphere is the upper mantle and the Earth’s crust that create landscape features such as mountains and valleys.
The biosphere includes all living things and their physical environment. It extends from several kilometers below the sea floor to about 8 km above the surface and requires the presence of water as well as an energy source of some kind. The range for individual species within the biosphere can change as local conditions within the other spheres change. (Christopherson, R.W. & Byrne ML).
Lab Exercises
In this introductory geography lab you will become familiar with the local geography and begin to think like a geographer.
This lab includes three exercises that result in creating an assignment to be handed in as a report in PDF format. The submitted report will include a series of figures with captions. The entire lab will take approximately 2 hours to complete.
Exercise 1 is mostly field-based, whereas Exercises 2 and 3 are office-based. The field sketch (see Worksheets for a blank sketch map template) should take approximately half an hour to complete. The rest of the lab will take the remaining time.
Contact your instructor for an alternative approach to these exercises if you are experiencing mobility or visual constraints.
Required materials:
- Camera (cell phone is fine).
- Pencil, clipboard, and some blank pieces of paper to sketch on.
- Appropriate clothing for the weather.
Required lab software (loaded on lab room computers):
- Google Maps
- Word processing software (Word, Google Docs)
EX1: Field Sketch
Step 1: Select Your Location
Start by choosing a field area and with a safe and easily accessible place where you can view the landscape from above as much as possible. Then open Google Maps on your phone or computer. Zoom into the area you will be viewing in the field. If you are on a desktop computer you will need to print the map, otherwise refer to the map on your phone or tablet while in the field. It will be helpful to watch the following two minute video:
- camera (cell phone is fine)
- clipboard, some blank pieces of paper, and a pencil, and
- a digital or printed copy of the lab exercises.
- optional: a smartphone with a map app (like Google maps)
Step 2: Orient Your Map
Once you have arrived at your viewpoint you will need to orient yourself to your location. Open a map of where you are on your phone or tablet or pull out the paper copy of the map.
- Find your location on the map. If you are on Google Maps this is easily done by pressing the small arrow. Zoom in or out to view the map at a scale that reflects what you can see in the landscape.
- Find features on the map that are evident in the surrounding terrain.
- Turn your map (phone) so that the features in front of your view match the features on your map.
- Determine the direction you are looking.
Step 3: Frame Your Field Sketch (Figure EX1.1)
You may be new to this area of British Columbia or you may have lived here your entire life; regardless, you can build your geographic literacy by being able to name and describe the natural and built features of the surrounding landscape. We will want you to label a few.
Find a suitable viewpoint and spend a few moments observing the landscape (see Figure 1.1).
Decide on an area that is appropriate to capture in your sketch. It may be a valley bottom with a river running through it or you could narrow in on a smaller area such as your neighborhood.
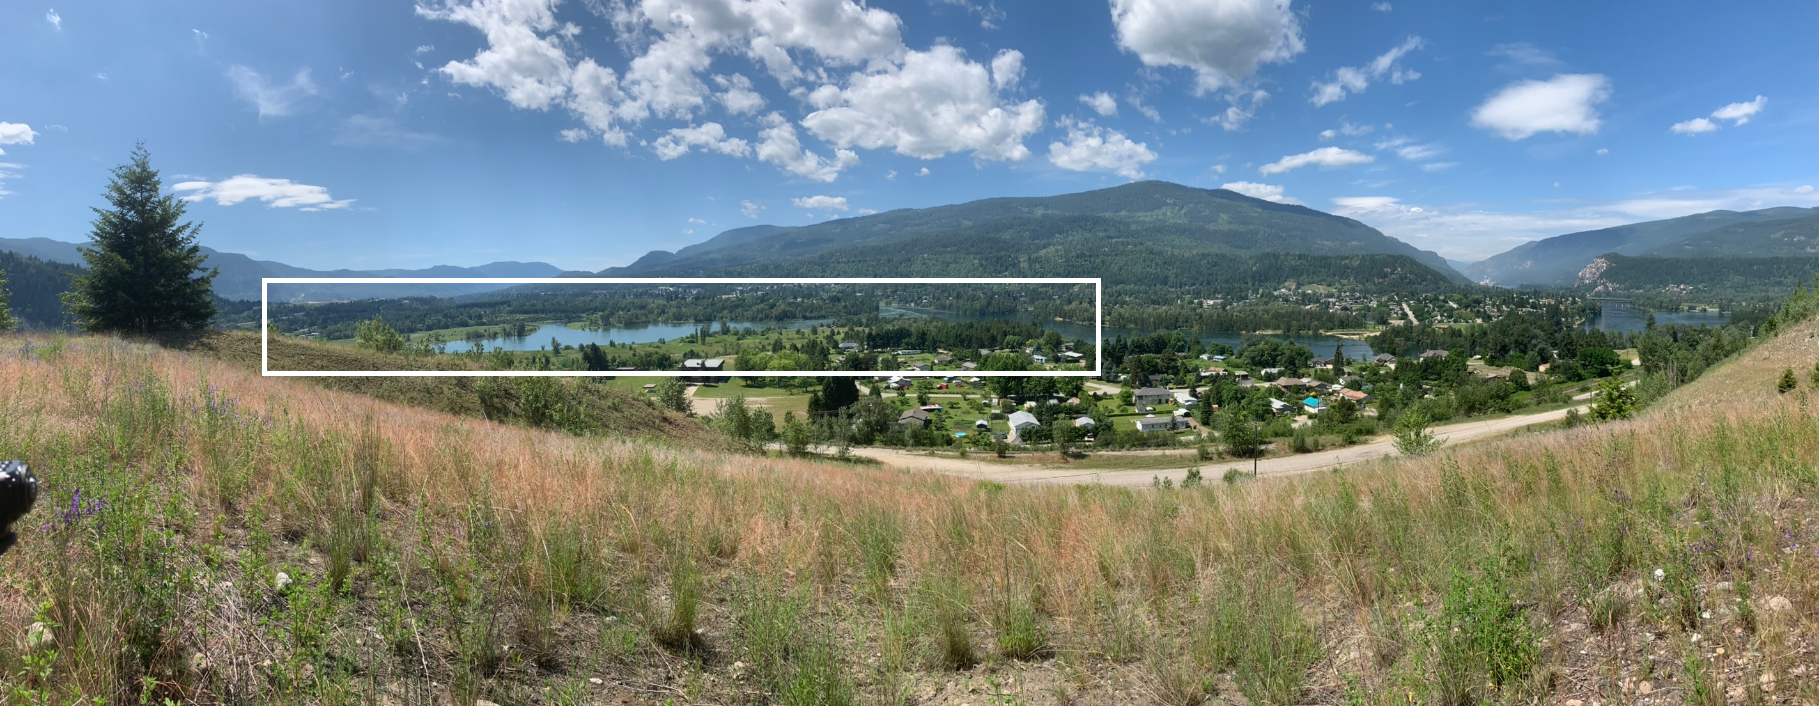
Photograph the landscape from your position. With annotation, this photograph will become Figure EX1.1 in your lab report (see example Figure 1.2).
Step 4: Create Your Field Sketch (Figure EX1.2)
Sketch and label the area you identified based on your observations. You do not need to be an artist to complete a field sketch. The most instructive field sketches are simple with clearly defined lines. This is an observation exercise, so only include features that you are able to observe.
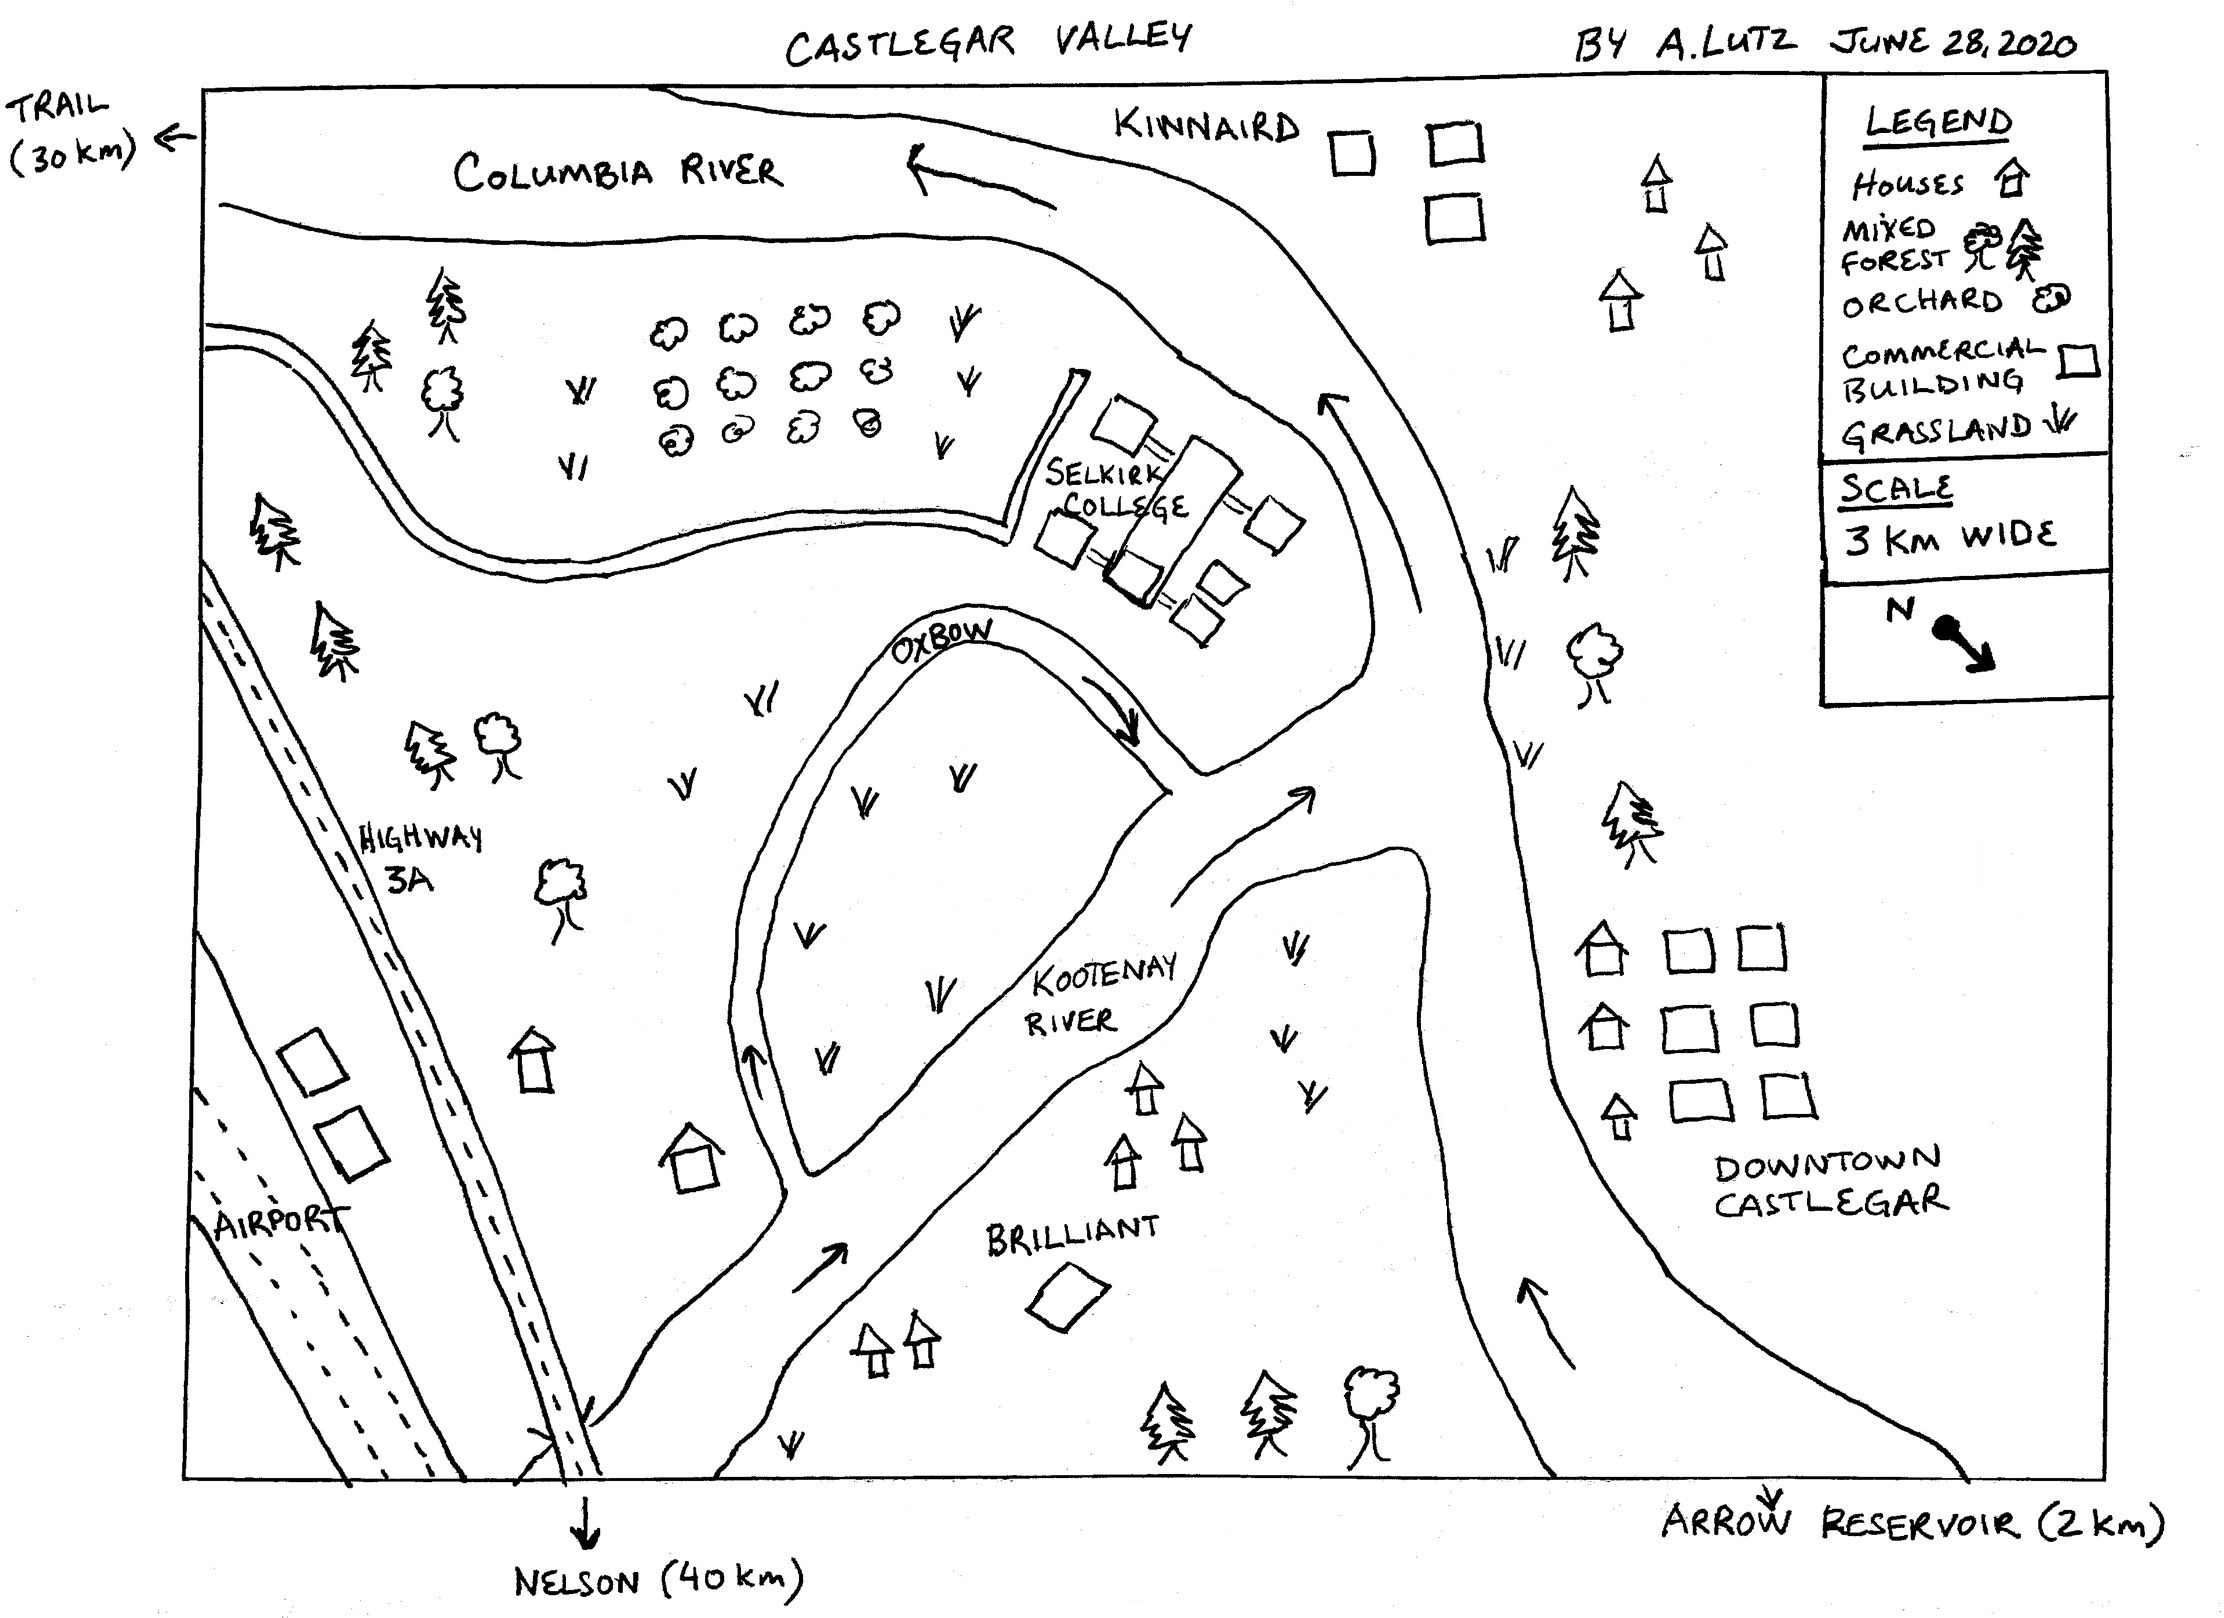
The following are important elements to consider as you draw your sketch. Refer to Figure 1.3 for a sample sketch map.
- Clearly define the boundaries or edges of your sketches. Mountains, watersheds, shorelines, roads and railways tend to define our vision and are commonly used as edges.
- Indicate the scale of your sketch. The scale of a sketch is determined by the size of the objects in view and the amount of detail required to be shown. Determine how much area you want to draw. From the viewpoint, the area in the rectangle on Figure 1.2 was selected for the sketch.
- Identify observed pathways or routes which dissect your selected area such as roads, trails, rivers, streams, power lines. We generally experience our surroundings as we move along these routes. Show direction of travel of rivers with an arrow.
- Identify any observed significant junction points where important pathways come together. The confluence (meeting) of two streams, the intersection of two roads.
- Identify polygons or districts. These are small areas with a common feature, such as urban areas, single family housing, parks, open fields, changes in vegetation type (from leaf bearing/deciduous to needle bearing/coniferous) etc. you can give them symbols or a common texture.
- Identify any significant landmarks that are distinctive because of their height, shape, or historical significance. An example might be a well-known mountain peak, a waterfall, a statue, a mall. (Lynch,1960)
- For marks, on your map you must also include
Photograph your sketch map before leaving the field.
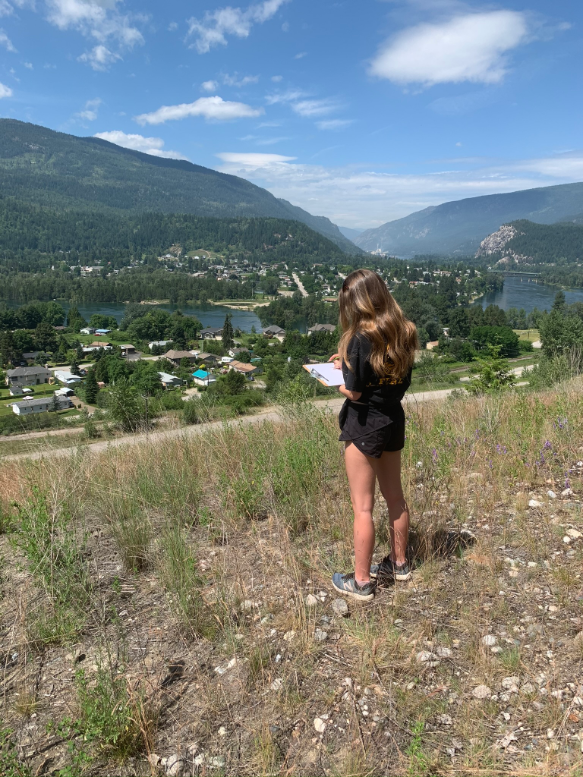
Step 5: Document Your Field Work with Photographs (Figure EX1.3)
Please take two photos in addition the the photo of your map area. First, take a selfie (photograph of yourself) at the field site holding your field sketch. Be sure to include a bit of the background landscape to show where picture is taken. Secondly, take a photograph of your map such that your map takes up most of the area of your picture, but still includes enough of the background so that it is obvious the picture was taken while you were still in the field.
Step 6: Create the Exercise 1 Portion of Your Lab Report
Once you are back inside, open a Word document on your computer, and create a title page for your lab report that includes the title of this lab assignment, your name, your lab instructor’s name, lab section number, and date.
Create the Exercise 1 portion of your lab report by inserting the title “Exercise 1: Field Sketch” and insert the figures you created in the field:
- Figure EX1.1: Photograph with markup of the frame of your field sketch. Insert the photo as a picture, and add a rectangle to indicate the boundary of your field sketch.
- Figure EX1.2: Field sketch. Insert the photo of your field sketch enlarged as much as possible to fit on an 8.5×11″ sheet of paper.
- Figure EX1.3: Documentation of field work. Insert your selfie.
Add descriptive captions to each figure to complete this portion of the report.
EX2: Earth Spheres
Create a new section of your lab report titled “Exercise 2: Earth Spheres”. Copy Table 1.1 below and paste into your lab report. The table is also available in Worksheets (Lab 01 Table).
Using the map, local knowledge, and if needed, a computer search, identify local features, processes and the associated characteristics of the hydrosphere, atmosphere, lithosphere and biosphere, and anthropogenic impacts. Complete the table with
- Landscape features: identify two to four features for each sphere. Describe each feature with, for example, size, location and significance; and
- Anthropogenic impacts: describe ways in which the sphere has been altered by humans. Be specific.
Your answers may pertain to the area in general and need not be restricted to the area represented by your field map.
| Sphere | Task Description | Landscape Features | Anthropogenic Impacts |
| Hydrosphere | Name oceans, streams, lakes, wetlands, bogs, and provide a description of relative size and significance in the landscape or note observations that indicate characteristics of the processes within the hydrosphere (e.g. signs of moisture avaialbility like distribution of vegetation, snow) | ||
| Atmosphere | Describe characteristics of local climate or note observations that indicate characteristics of the processes within the atmosphere (e.g., consider annual averages and the season/month, temperature range, evidence of climatic changes). | ||
| Lithosphere | Name geomorphological features (e.g., mountains, valleys, plateaus, terraces, floodplains, gullies, excavations for roads, mines, buildings) and their characteristics (steepness), aspect (compass direction they are facing) or history of evolution. |
|
|
| Biosphere | Describe vegetation types (e.g., coniferous*, deciduous**, grasslands, shrubs, mosses, urbanized), spatial extent and distribution (e.g., dense, sparse, regular, irregular), aspect (i.e. direction slope faces). |
*Coniferous tree is a needle leaf tree that bears cones
**Deciduous tree is a leaf bearing tree that sheds its leaves seasonally
EX3: Systemic Change
We are living through an era of rapid environmental change. Consider ways in which a change in one sphere may affect all others in your area. Point form is encouraged.
- Specific to the entire view of the landscape you are observing, describe (in point form) how a catastrophic (very large) wildfire might impact each sphere. Consider both the immediate impacts and long-term impacts. List 4-7 impacts with separate bullets for each impact. Burning of vegetation and structures as well as possible loss of life may be obvious impacts on the biosphere. However, please consider impacts both long term and short term on other spheres. It might be helpful to look ahead in your textbook for ideas (using the index).
| Sphere | |||
| Hydrosphere |
|
||
| Atmosphere |
|
||
| Lithosphere |
|
||
| Biosphere |
|
Create a new section of your lab report titled “Exercise 3: Systemic Change” and type in your answers.
Reflection Questions
In answering the following questions, if applicable, be sure to connect your learning to your past lived experience and any future learning.
- Now that you have completed a field sketch, describe how this process differs from simply printing a map or taking a photograph to note evidence of processes shaping the landscape. (1-2 sentences)
- What information could be conveyed on a field sketch map that is not available on photographs, remotely sensed images or a published government map? (3 sentences)
- Describe “the sense of place” this area has for you; this will be different for each student depending on your life experiences. For example, are you connected to this landscape? Are you concerned or optimistic about how the landscape is changing? Try to be honest here, do not write what you think your instructor is looking for. (3-5 sentences)
- Please describe at least one aspect of the features that you observed that you are curious about.
Create a new section of your lab report titled “Reflection Questions” and type in your answers.
Report Submission
Once all exercises are complete, save the assignment as a PDF and submit as directed by your instructor.
References
Christopherson, R.W. & Byrne ML. 2016. Geosystems, An Introduction to Physical Geography, Canadian 4th Edition, Toronto: Prentice-Hall Inc.
Lynch, Kevin. 1960. The Image of the City. MIT Press.
